2022
NOTICE OF ANNUAL MEETING
AND PROXY STATEMENT
May 4, 2022
New York, NY
Filed by the Registrant ☒ | | |
| | Filed by a party other than the Registrant ☐ |
☐ | | | Preliminary Proxy Statement |
☐ | | | Confidential, for Use of the Commission Only (as permitted by Rule 14a-6(e)(2)) |
☒ | | | Definitive Proxy Statement |
☐ | | | Definitive Additional Materials |
☐ | | | Soliciting Material under §240.14a-12 |
☒ | | | No fee required |
| | | Fee paid previously with preliminary materials | |
| | | Fee computed on table |


| 1. | To elect the |
| 2. | To consider and vote on a proposal to ratify the appointment of Deloitte & Touche LLP as our independent registered public accounting firm for |
| 3. | To consider and vote, on a non-binding advisory basis, on a resolution to approve the compensation of our named executive officers as described in the Proxy Statement; |
| 4. | To determine, on a non-binding advisory basis, the frequency of future advisory votes on the compensation of our named executive officers; and |
| To transact such other business as may properly come before the Annual Meeting, including any |
| | | Page | |
| | | ||
| | | ||
| | | ||
| | | ||
| | | ||
| | | ||
| | | ||
| | | ||
| | | ||
| | | ||
| | | ||
| | | ||
| | | ||
| | | ||
| | | ||
| | | ||
| | | ||
| | |||
| | | ||
| | | ||
| | | ||
| | | ||
| | | ||
| | | ||
| | | ||
| | | ||
| | |||
| | | ||
| | | ||
| | | ||
| | | ||
| | | ||
| | | ||
| | | ||
| | | ||
| All Other Compensation Table | | | |
| | | ||
| | | ||
| | | ||
| | |
| | | Page | |
| | | ||
| | | ||
| | | ||
| | | ||
| | | ||
| | |||
| | | ||
| | | ||
| | | ||
| | | ||
| | | ||
| | | ||
| | | ||
| | | ||
| | | ||
| | | ||
| | | ||
| | | ||
| | | ||
| | | ||
| | | ||
| | | ||
| | |
Name | | | Age | | | Trustee Since | | | Position |
Jeffrey S. Olson | | | 54 | | | 2014 | | | Trustee (Chairman) and Chief Executive Officer |
Amy B. Lane(1) | | | 69 | | | 2015 | | | Trustee (Lead Trustee) |
Susan L. Givens(2) | | | 45 | | | 2021 | | | Trustee |
Michael A. Gould(1) | | | 79 | | | 2015 | | | Trustee |
Steven H. Grapstein | | | 64 | | | 2015 | | | Trustee |
Steven J. Guttman | | | 75 | | | 2015 | | | Trustee |
Norman K. Jenkins | | | 59 | | | 2021 | | | Trustee |
Kevin P. O'Shea | | | 56 | | | 2014 | | | Trustee |
Steven Roth | | | 80 | | | 2015 | | | Trustee |
Douglas W. Sesler | | | 60 | | | 2020 | | | Trustee |
| (1) | Not standing for re-election at the Annual Meeting. Following the Annual Meeting, our Board size will be reduced from ten to eight Trustees. |
| (2) | Ms. Givens has been elected by the Company’s independent Trustees to serve as Lead Trustee following the expiration of Ms. Lane’s term on May 4, 2022. See “Corporate Governance and Related Matters—Lead Trustee.” |
| Name | Age | Trustee Since | Position | |||
| Jeffrey S. Olson | 50 | 2014 | Trustee (Chairman) and Chief Executive Officer | |||
| Michael A. Gould | 75 | 2015 | Trustee (Lead Trustee) | |||
| Steven H. Grapstein | 60 | 2015 | Trustee | |||
| Steven J. Guttman | 71 | 2015 | Trustee | |||
| Amy B. Lane | 65 | 2015 | Trustee | |||
| Kevin P. O'Shea | 52 | 2014 | Trustee | |||
| Steven Roth | 76 | 2015 | Trustee | |||
Jeffrey S. Olson Chairman and Chief Executive Officer Trustee Since: 2014 Age: 54 | | | Jeffrey S. Olson has served as our Chairman and Chief Executive Officer since December 29, 2014 and has served as a Trustee since December 19, 2014. Mr. Olson served as chief executive officer and a member of the board of directors of Equity One, Inc. (“Equity One”) from 2006 until September 1, 2014, at which time Mr. Olson joined Vornado Realty Trust (“Vornado”) in order to work on the separation of the Company from Vornado. From 2006-2008, Mr. Olson also served as the president of Equity One. Prior to joining Equity One, he served as president of the Eastern and Western Regions of Kimco Realty Corporation from 2002 to 2006. Mr. Olson Mr. Olson’s qualifications to serve on our Board include his role as our Chief Executive Officer, his experience as chief executive officer and a board member of Equity One and general expertise in real estate operations, as well as his knowledge of the REIT industry developed as an analyst covering many U.S. REITs. Mr. Olson currently serves as |
Susan L. Givens | ||
Trustee Trustee Since: Age: 45 | ||
| | Ms. Givens has nearly 20 years of private equity, capital markets, M&A, general management and finance experience. She has served as The Real Estate Roundtable. Ms. Givens’ qualifications to serve on our Board include |
Steven H. Grapstein Trustee | ||
Trustee Since: 2015 Age: 64 | ||
| | Steven H. Grapstein has served as a Trustee since January 14, 2015. Mr. Grapstein has been Chief Executive Officer of Como Holdings USA, Inc., an international investment group, since January 1997. From September 1985 to January 1997, Mr. Grapstein was a Vice President of Como Holdings USA, Inc. Since November 2015, Mr. Grapstein has served on the Board of Directors of David Yurman, a leading fine jewelry and luxury timepiece retailer with over 360 locations worldwide. Since November 2003, Mr. Grapstein has served on the Board of Directors of Mulberry Plc, a UK listed company that wholesales and retails luxury leather goods in over 30 countries. Mr. Grapstein also held the position of Chairman of Presidio International dba A/X Armani Exchange, a fashion retail company from 1999 to June 2014. Mr. Grapstein served as Chairman of Tesoro Corporation (NYSE: TSO) from 2010 through 2014 and served on its board from 1992 through May 2015. Mr. Grapstein Mr. Grapstein’s qualifications to serve on our Board include his broad experience in the real estate and retail sectors across a variety of companies, as well as the knowledge of board responsibilities and mechanics he brings from his experience as a former Chairman of a Fortune 100 public company and service on multiple board committees. |
Steven J. Guttman | |
Trustee | |
Trustee Since: 2015 Age: 75 | |
| | Steven J. Guttman has served as a Trustee since January 14, 2015. Mr. Guttman is a real estate industry veteran with over 40 years of experience. In January of 2013, Mr. Guttman founded UOVO Fine Art Storage, which is developing next generation, high-tech facilities for fine art storage, and currently serves as UOVO’s Chairman. Prior to founding UOVO, Mr. Guttman had a 30-year career with Mr. Guttman’s qualifications to serve on our Board include his extensive career at a large, successful retail REIT (culminating with his service as Chief Executive Officer and Chairman of the Board), and his experience in the REIT industry generally, including his participation in NAREIT. | |
Norman K. Jenkins | ||
Trustee | ||
Trustee Since: Age: 59 | ||
| | Mr. Jenkins brings over 25 years of real estate and executive leadership experience. In 2009, he founded Capstone Development, LLC, a real estate company focused on the acquisition and development institutional-quality lodging assets affiliated with top-tier national lodging brands, where he currently serves as President, Chief Executive Officer and Managing Partner. Prior to that, Mr. Jenkins spent 16 years with Marriot International, serving in several leadership positions before being named Senior Vice President of North American Lodging Development. Mr. Jenkins was certified public accountant. Mr. Jenkins' qualifications to serve on our Board include |
Kevin P. O'Shea Trustee Trustee Since: 2014 Age: 56 | | | Kevin P. O’Shea has served as a Trustee since December 29, 2014. Mr. O’Shea has been the Chief Financial Officer of AvalonBay Communities, Inc., a multifamily real estate investment trust, since May Mr. O’Shea’s qualifications to serve on our Board include his education and experience in business and legal roles, his extensive experience in the REIT sector and his financial expertise stemming from his experience as the Chief Financial Officer of a major REIT, and his experience in the real estate investment banking sector. |
Steven Roth | ||
Trustee | ||
Trustee Since: Age: 80 | ||
| | Steven Roth has served as a Trustee since January 14, 2015. Mr. Roth has been the Chairman of the Board of Trustees of Vornado, a real estate investment trust, since May 1989 and Chairman of the Executive Committee of the Board of Trustees of Vornado since April 1980. From May 1989 until May 2009, Mr. Roth served as Vornado’s Chief Executive Officer, and has been serving as Chief Executive Officer again from April 15, 2013 until the present. Since 1968, he has been a general partner of Interstate Properties and he currently serves as its Managing General Partner. He is the Chairman of the Board and Chief Executive Officer of Alexander’s, Inc. Mr. Roth’s qualifications to serve on our Board include his experience in leadership and board responsibilities for a major REIT (as well as with other significant real estate companies), his deep understanding of the class of assets held by the Company and his many years of experience in the real estate field generally. | |
Douglas W. Sesler Trustee | |||
Trustee Since: Age: 60 | | | Douglas W. Sesler has served as a Trustee since March 20, 2020. Most recently, Mr. Sesler served as the Head of Real Estate for Macy's, Inc., a position he held from April 2016 to April 2021. From 2011 to 2016, Mr. Sesler was president of True Square Capital LLC, a real estate investment and advisory firm. From 2005 to 2011, he was employed at Bank of America Merrill Lynch International Ltd. in roles that included global head of principal real estate investments and global co-head of real estate investment banking. From 1989 to 2005, Mr. Sesler served in a variety of roles at Citigroup and its predecessors, including as managing director of the global real estate investment banking group and managing director of the Travelers Realty Investment Company. He began his career in real estate roles at Chemical Bank. Mr. Sesler served on the board of directors of Gazit Globe Ltd., an international owner, developer and operator of shopping centers from January 2012 to November 2020. Mr. Sesler received a B.A. in Government from Cornell University. Mr. Sesler's qualifications to serve on our Board include his extensive experience in the real estate sector, including in an executive position with one of the largest U.S. department store companies, as well as his experience in the real estate investment banking sector. |
THE BOARD OF TRUSTEES RECOMMENDS A VOTE “FOR” EACH OF THE NOMINEES. |
Trustee | | | ||||||||
Audit Committee | | Compensation Committee | | | Corporate Governance and Nomination Committee | |||||
Susan L. Givens(1) | | | • | | | • | | | ||
Michael A. | | | | • | | | • | |||
Steven H. Grapstein | | • | | | | | Chair | |||
Norman K. Jenkins | | | • | | | • | ||||
Douglas W. Sesler | | | • | | | | | • | ||
Amy B. Lane(1)(2) | | | Chair | | | • | ||||
Kevin P. | | Chair | | | • | | |
| (1) | Ms. Lane is the Company’s current Lead Trustee. Following the expiration of her board term on May 4, 2022, Ms. Givens will serve as the Company’s Lead Trustee. |
| (2) | Not standing for re-election at the 2022 Annual Meeting | ||||||
| † | Audit Committee Financial Expert |
BOARD AND LEADERSHIP PRACTICES | |||
✔ | | | Majority of Trustees are independent (9 out of 10 current Trustees) |
✔ | | | Board leadership structure where the Lead Trustee has well-defined responsibilities separate from the Chairman of the Board |
✔ | | | All Board committees are composed of independent Trustees |
✔ | | | Independent Trustees conduct regular executive sessions |
✔ | | | Trustees maintain open communication and strong working relationships among themselves and regular access to management |
✔ | | | Trustees conduct robust annual Board and committee self-assessment process |
✔ | | | Trustees and executives adhere to minimum share ownership guidelines |
✔ | | | Executives are prohibited from pledging, hedging or engaging in short sales involving our securities |
✔ | | | Executives are subject to a clawback policy |
SHAREHOLDER RIGHTS | |||
✔ | | | All Trustees elected annually (declassified Board) |
✔ | | | Trustees are elected by a majority of the votes cast |
✔ | | | Trustee resignation policy in uncontested elections for failure to receive majority support |
✔ | | | Market standard proxy access |
✔ | | | Unqualified shareholder right to amend Bylaws |
✔ | | | Opted out of the Maryland Business Combination Act and the Maryland Control Share Acquisition Act |
✔ | | | No poison pill |
✔ | | | Annual say-on-pay voting |
✔ | | | Shareholder engagement efforts |
| (1) | each receives an annual cash retainer equal to |
| (2) | each receives an annual grant of restricted Common Shares or deferred share units (“DSUs”) or restricted LTIP |
| (3) | the Lead Trustee receives an additional annual cash retainer of $40,000; |
| (4) | the |
| (5) | the |
| (6) | the |
| (7) | members of the Audit, Compensation and Corporate Governance and Nominating Committees receive additional annual cash retainers of $12,500, $10,000 and $7,500, respectively. |
Name | | | Fees Earned or Paid in Cash ($) | | | Stock Awards ($)(1)(2) | | | Total ($) |
Susan L. Givens | | | 48,750 | | | 184,106 | | | 232,856 |
Michael A. Gould(3) | | | 92,500 | | | 100,015 | | | 192,515 |
Steven H. Grapstein | | | 102,500 | | | 99,975 | | | 202,475 |
Steven J. Guttman | | | 77,500 | | | 99,975 | | | 177,475 |
Norman K. Jenkins | | | 8,036 | | | 144,648 | | | 152,684 |
Amy B. Lane(3) | | | 142,500 | | | 99,975 | | | 242,475 |
Kevin P. O'Shea | | | 110,000 | | | 99,975 | | | 209,975 |
Steven Roth | | | 75,000 | | | 99,975 | | | 174,975 |
Douglas W. Sesler | | | 91,250 | | | 99,975 | | | 209,975 |
| Name | Fees Earned or Paid in Cash ($) | Stock Awards ($)(1)(2) | Total ($) | |||
| Michael A. Gould | $115,000 | $100,000 | $215,000 | |||
| Steven H. Grapstein | $90,000 | $100,000 | $190,000 | |||
| Steven J. Guttman | $72,500 | $100,000 | $172,500 | |||
| Amy B. Lane | $95,000 | $100,000 | $195,000 | |||
| Kevin P. O'Shea | $95,000 | $100,000 | $195,000 | |||
| Steven Roth | $62,500 | $100,000 | $162,500 | |||
| (1) | The amounts disclosed in the “Stock Awards” column represent the aggregate grant date fair value of restricted Common Shares, LTIP Units or DSUs granted at each Trustee's election during 2021 as measured pursuant to Financial Accounting Standards Board Accounting Standards Codification Topic 718, Compensation - Stock Compensation (FASB ASC Topic 718). Mr. Gould elected to receive DSUs and Messrs. Grapstein, Guttman, Jenkins, O’Shea, Sesler, and Roth, as well as Mss. Lane and Givens elected to receive LTIP Units. In addition, Mr. Jenkins and Ms. Givens received an additional grant of 7,127 and 6,850 LTIP Units respectively, in connection with joining the Board. The grant date fair value of the DSUs was estimated using the following assumptions: an expected holding period of five years, an expected volatility of 41% and a risk-free interest rate of 0.62%. The grant date fair value of the LTIPs was estimated using the following assumptions: an expected holding period of five years, an expected volatility of 60% and a risk-free interest rate of 0.07%. |
| (2) | As of December 31, 2021, each individual who served as a non-employee Trustee during 2021 had outstanding the following number of unvested Common Shares, LTIP Units and DSUs: |
Name | | | Shares/ LTIP Units/DSUs |
Givens | | | 5,404 |
Gould | | 6,476 | |
Grapstein | | 6,626 | |
Guttman | | 6,626 | |
Jenkins | | 3,081 | |
Lane | | 6,626 | |
O'Shea | | 6,626 | |
Roth | | 6,626 | |
Sesler | | | 6,626 |
| (3) | Not standing for re-election at the 2022 Annual Meeting. |
Name | | | Age | | | Position |
Jeffrey S. Olson | | 54 | | | Chairman and Chief Executive Officer | |
Christopher J. Weilminster | | 56 | | | Executive Vice President and Chief Operating Officer | |
Mark J. Langer | | 55 | | | Executive Vice President and Chief Financial Officer | |
Herbert Eilberg | | 45 | | | Chief Investment Officer | |
Danielle De Vita | | | 51 | | | Executive Vice President, |
Jennifer Holmes | | 41 | | | Chief Accounting Officer | |
Robert C. Milton III | | 50 | | | Executive Vice President, General Counsel and Secretary |
| | | Common Shares | | | Common Shares and Units | |||||||
Name** | | | Number of Shares Beneficially Owned(1) | | | Percent of Common Shares(2) | | | Number of Shares and Units Beneficially Owned(1) | | | Percent of Common Shares and Units(2) |
5% Holders | | | | | | | | | ||||
The Vanguard Group(3) | | | 16,875,873 | | | 14.4% | | | 16,875,873 | | | 13.6% |
BlackRock, Inc.(4) | | | 15,848,148 | | | 13.5% | | | 15,848,148 | | | 12.8% |
Resolution Capital Limited(5) | | | 10,544,979 | | | 9.0% | | | 10,544,979 | | | 8.5% |
Invesco Ltd. (6) | | | 7,946,685 | | | 6.8% | | | 7,946,685 | | | 6.4% |
State Street Corporation(7) | | | 5,919,403 | | | 5.0% | | | 5,919,403 | | | 4.8% |
Massachusetts Financial Services Company(8) | | | 4,082,295 | | | 3.5% | | | 4,082,295 | | | 3.3% |
Directors, Nominees for Director and Named Executive Officers | | | | | | | | | ||||
Jeffrey S. Olson, Chairman and Chief Executive Officer(9) | | | 2,560,317 | | | 2.1% | | | 3,218,613 | | | 2.5% |
Susan L. Givens, Trustee(10) | | | — | | | * | | | 12,254 | | | * |
Michael A. Gould, Trustee(11) | | | 8,595 | | | * | | | 49,516 | | | * |
Steven H. Grapstein, Trustee(12) | | | 8,595 | | | * | | | 49,936 | | | * |
Steven J. Guttman, Trustee(13) | | | 13,147 | | | * | | | 49,936 | | | * |
Norman K. Jenkins, Trustee(14) | | | — | | | * | | | 10,208 | | | * |
Amy B. Lane, Trustee(15) | | | 8,595 | | | * | | | 49,936 | | | * |
Kevin P. O'Shea, Trustee(16) | | | 11,325 | | | * | | | 49,936 | | | * |
Steven Roth, Trustee(17) | | | 3,765,568 | | | 3.2% | | | 3,806,909 | | | 3.1% |
Douglas W. Sesler, Trustee(18) | | | — | | | * | | | 31,788 | | | * |
| | | Common Shares | | | Common Shares and Units | |||||||
Name** | | | Number of Shares Beneficially Owned(1) | | | Percent of Common Shares(2) | | | Number of Shares and Units Beneficially Owned(1) | | | Percent of Common Shares and Units(2) |
Christopher J. Weilminster, Executive Vice President and Chief Operating Officer(19) | | | 335,333 | | | * | | | 677,977 | | | * |
Mark J. Langer, Executive Vice President and Chief Financial Officer(20) | | | 350,839 | | | * | | | 534,576 | | | * |
Herbert Eilberg, Chief Investment Officer(21) | | | 33,097 | | | * | | | 73,945 | | | * |
Robert Milton, Executive Vice President, General Counsel & Secretary(22) | | | — | | | * | | | 35,626 | | | * |
All Directors and Executive Officers as a Group (16 Persons)(23) | | | 7,141,367 | | | 5.9% | | | 8,754,435 | | | 6.9% |
| Name of Beneficial Owner | Number of Common Shares and Units(1)(2) | Percent of All Shares(1)(2)(3) | Percent of All Shares and Units(1)(2)(4) | |||
The Vanguard Group, Inc.(5) | 17,382,025 | 15.26% | 13.75% | |||
Blackrock, Inc.(6) | 13,842,208 | 12.15% | 10.95% | |||
T.Rowe Price Associates, Inc.(7) | 10,358,709 | 9.09% | 8.20% | |||
FMR LLC (8) | 9,289,943 | 8.15% | 7.35% | |||
Cohen & Steers, Inc./ Cohen & Steers Capital Management, Inc. (9) | 8,935,385 | 7.84% | 7.07% | |||
Vanguard Specialized Funds (10) | 7,659,766 | 6.72% | 6.06% | |||
T. Rowe Price Real Estate Fund, Inc. (11) | 5,711,850 | 5.01% | 4.52% | |||
Steven Roth, Trustee (12)(13) | 4,120,426 | 3.62% | 3.26% | |||
Michael A. Gould, Trustee (12) | 16,822 | * | * | |||
Steven H. Grapstein, Trustee (12) | 16,822 | * | * | |||
Steven J. Guttman, Trustee (12) | 16,822 | * | * | |||
Amy B. Lane, Trustee (12) | 16,822 | * | * | |||
Kevin P. O'Shea, Trustee (12) | 16,822 | * | * | |||
Jeffrey S. Olson, Chairman and Chief Executive Officer (12) | 857,915 | * | * | |||
Robert Minutoli, Executive Vice President and Chief Operating Officer (12) | 183,625 | * | * | |||
Mark J. Langer, Executive Vice President and Chief Financial Officer (12) | 175,079 | * | * | |||
Michael Zucker, Executive Vice President - Leasing (12) | 47,283 | * | * | |||
Herbert Eilberg, Executive Vice President and Chief Investment Officer (12) | 43,914 | * | * | |||
| All Trustees and Executive Officers as a Group | 5,512,352 | 4.84% | 4.36% | |||
| * | Represents beneficial ownership of less than 1% of outstanding Common Shares. |
| “Number of Shares Beneficially Owned” includes Common Shares that may be acquired upon the exercise of options exercisable on or within 60 days after March 7, 2022. The |
| (2) | The total number of Common Shares outstanding used in calculating the percentage of Common Shares held by each |
| (3) | Based on information provided on a Schedule 13G/A filed with the SEC on February 10, 2022, as of December 31, 2021, by The Vanguard Group (“Vanguard”). Vanguard reported sole dispositive power with respect to 16,570,387 Common Shares, shared dispositive power with respect to 305,486 Common Shares, sole voting power with respect to 0 Common Shares and shared voting power with respect to 207,213 Common Shares. The business address of Vanguard is |
| (4) | Based on information provided on a Schedule 13G/A filed with the SEC on January 27, 2022, as of December 31, 2021, by BlackRock, Inc (“BlackRock”). BlackRock reported sole dispositive power with respect to 15,848,148 Common Shares and sole voting power with respect to 14,973,912 Common Shares. The business address for BlackRock. is 55 East 52nd Street, New York, NY 10022. |
| (5) | Based on information provided on a Schedule 13G/A filed with the SEC on February 14, 2022, as of December 31, 2021, by Resolution Capital Limited (“Resolution”). Resolution reported sole dispositive power with respect to 10,544,979 Common Shares and sole voting power with respect to 10,544,979 Common Shares. The business address for Resolution is Level 38, 264 George St, Sydney, Australia 2000. |
| (6) | Based on information provided on a Schedule 13G filed with the SEC on February 14, 2022, as of December 31, 2021, by Invesco Ltd (“Invesco”). Invesco reported sole dispositive power with respect to 7,946,685 Common Shares, shared dispositive power with respect to 0 Common Shares, sole voting power with respect to 4,521,600 Common Shares and shared voting power with respect to 0 Common Shares. The business address for Invesco is 1555 Peachtree Street NE, Suite 1800, Atlanta, GA 30309. |
| (7) | Based on information provided on a Schedule 13G filed with the SEC on February 10, 2022, as of December 31, 2021, by State Street Corporation (“State Street”). State Street reported sole dispositive power with respect to 0 Common Shares, shared dispositive power with respect to 5,919,403 Common Shares, sole voting power with respect to 0 Common Shares and shared voting power with respect to 4,913,890 Common Shares. The business address for State Street is State Street Financial Center, 1 Lincoln Street, Boston, MA 02111. |
| (8) | Based on information provided on a Schedule 13G/A filed with the SEC on February 2, 2022, as of December 31, 2021, by Massachusetts Financial Services Company (“MFS”). MFS reported sole dispositive power with respect to 4,082,295 Common Shares and sole voting power with respect to 3,941,397 Common Shares. The business address for MFS is 111 Huntington Avenue, Boston, MA 02199. |
| (9) | Includes (i) 29,466 Common Shares together with 2,530,851 options, and (ii) only under “Number of Shares and Units Beneficially Owned” column, 658,296 LTIP Units. See “Outstanding Equity Awards at Fiscal Year End” on page 46 for additional detail regarding the options. |
| (10) | Includes only under “Number of Shares and Units Beneficially Owned” column, 12,254 LTIP Units. |
| (11) | Includes only under “Number of Shares and Units Beneficially Owned” column, 12,164 LTIP Units and 28,757 DSUs. |
| (12) | Includes only under “Number of Shares and Units Beneficially Owned” column, 41,341 LTIP Units. |
| (13) | Includes only under “Number of Shares and Units Beneficially Owned” column, 36,789 LTIP Units. |
| (14) | Includes only under “Number of Shares and Units Beneficially Owned” column, 7,127 LTIP Units. |
| (15) | Includes only under “Number of Shares and Units Beneficially Owned” column, 36,789 LTIP Units and 4,552 DSUs. |
| (16) | Includes only under “Number of Shares and Units Beneficially Owned” column, 36,789 LTIP Units and 1,822 DSUs. |
| (17) | Includes, only under “Number of Shares and Units Beneficially Owned” column, 41,341 LTIP Units inclusive of 22,324 LTIP Units held by SR Family Holdings (a limited liability company controlled by Mr. Roth). Mr. Roth’s total beneficial ownership amount includes 2,802,526 Common Shares held by Interstate Properties (a New Jersey general partnership of which Mr. Roth is the managing general partner), 809,290 Common Shares held by SR Family Holdings, 18,649 Common Shares held by Mr. Roth’s spouse and 38,067 Common Shares held in trust for Mr. Roth's children. Mr. Roth does not deem the holding of these Common Shares as an admission of beneficial ownership. |
| (18) | Includes, only under “Number of Shares and Units Beneficially Owned” column, 31,788 LTIP Units. |
| (19) | Includes (i) 2,000 Common Shares together with 333,333 options and (ii) only under “Number of Shares and Units Beneficially Owned” column, 342,644 LTIP Units. See “Outstanding Equity Awards at Fiscal Year End” on page 46 for additional detail regarding the options. |
| (20) | Includes (i) 33,066 Common Shares and 317,773 options and (ii) only under “Number of Shares and Units Beneficially Owned” column, 183,737,576 LTIP Units. See “Outstanding Equity Awards at Fiscal Year End” on page 46 for additional detail regarding the options. |
| (21) | Includes, only under “Number of Shares and Units Beneficially Owned” column, 40,848 LTIP Units. |
| (22) | Includes, only under “Number of Shares and Units Beneficially Owned” column, 35,626 LTIP Units. |
| (23) | Includes (i) an aggregate of 3,932,383 Common Shares together with 3,208,984 options, and (ii) only under the “Number of Shares and Units Beneficially Owned” column, 1,613,068 LTIP Units. See also Notes (9) - (22) above. |
THE BOARD OF TRUSTEES RECOMMENDS A VOTE “FOR” THE RATIFICATION OF THE APPOINTMENT OF OUR INDEPENDENT REGISTERED PUBLIC ACCOUNTING FIRM. |
| | | 2021 | | | 2020 | |
Audit Fees(1) | | | $942,000 | | | $942,000 |
Audit-Related Fees(2) | | | 507,000 | | | 357,000 |
Tax Fees(3) | | | 239,000 | | | 230,000 |
All Other Fees | | | — | | | — |
Total Fees | | | $1,688,000 | | | $1,529,000 |
| 2017 | 2016 | ||||||
Audit fees(1) | $ | 895,000 | $ | 862,000 | |||
Audit-related fees(2) | 898,000 | 311,000 | |||||
Tax fees(3) | 358,000 | 265,000 | |||||
| Total Fees | $ | 2,151,000 | $ | 1,438,000 | |||
(1) | Represents the aggregate fees billed by Deloitte for the years ended December 31, |
(2) | Represents the aggregate fees billed by Deloitte for the years ended December 31, |
| (3) | Represents the aggregate fees billed by Deloitte for the years ended December 31, 2021 and 2020, respectively, for professional services rendered for tax compliance, tax advice and tax planning. Tax fees generally include fees for |
| | | Kevin P. O’Shea (Chair) | |
| | | Susan L. Givens | |
| | | Steven H. Grapstein | |
| | | Douglas W. Sesler |
 | | |  |
| • | Generated FFO as Adjusted(1) of $133.5 million, or $1.09 per share, for the year ended December 31, 2021 compared to $107.5 million, or $0.88 per share, for the year ended December 31, 2020; |
| (1) | Please see “Non-GAAP Financial Measure” beginning on page 62 for reconciliations of non-GAAP measures to the most directly comparable GAAP measures. |
| Name | Target 2017 STI Opportunity (as a % of Salary) | Actual 2017 STI Award (as % of Salary) | Actual 2017 STI Award ($)(1) | |||
| Mr. Olson | 100% | 160% | $1,601,268 | |||
| Mr. Langer | 100% | 153% | $803,502 | |||
| Mr. Minutoli | 100% | 137% | $684,384 | |||
| Mr. Zucker | 100% | 127% | $537,649 | |||
| Mr. Eilberg | 115% | 138% | $483,908 | |||
Executive | | | Base Salary | | | Target Bonus | | | Long-Term Equity Incentive Grant |
Jeffrey S. Olson (CEO) | | | $1,050,000 | | | 110% of base salary | | | $3,700,000 |
| | | | | | | ||||
Christopher J. Weilminster (COO) | | | $600,000 | | | 100% of base salary | | | $1,500,000 |
| | | | | | | ||||
Mark J. Langer (CFO) | | | $603,750 | | | 100% of base salary | | | $914,944 |
| | | | | | | ||||
Herbert Eilberg (CIO) | | | $367,500 | | | 115% of base salary | | | $400,000 |
| | | | | | | ||||
Robert C. Milton III (GC) | | | $400,000 | | | 100% of base salary | | | $213,912 |
| Executive | Base Salary | Bonus | Annual Equity Grants | |||||
Jeffrey S. Olson (Chairman and Chief Executive Officer) | $ | 1,000,000 | Annual target bonus of no less than 100% of base salary payable 50% in cash and 50% in equity awards that vest ratably over four years. | Annual grants of stock options with a grant date Black Scholes value equal to $500,000 and vesting ratably over four years, subject to continued employment through each vesting date. | ||||
Mark J. Langer (Executive Vice President and Chief Financial Officer) | $525,000 | Annual target bonus of no less than 100% of base salary payable 50% in cash and 50% in equity awards that vest ratably over three years. | Annual grants of stock options with a grant date Black Scholes value equal to $200,000 and vesting ratably over three years, subject to continued employment through each vesting date. | |||||
Robert Minutoli (Executive Vice President and Chief Operating Officer) | $500,000* | Annual target bonus of no less than 100% of base salary payable 100% in cash. | Annual target grants of a number of LTIP Units equal to $350,000 divided by the FMV of one Common Share on grant date and vesting ratably over three years, subject to continued employment through each vesting date. | |||||
Michael Zucker (Executive Vice President - Leasing) | $425,000 | No employment agreement or offer letter | ||||||
Herbert Eilberg (Chief Investment Officer) | $350,000 | N/A | N/A | |||||
| • | Market capitalization no less than approximately one half (1∕2) and no more than approximately three (3) times the market capitalization of the Company. |
Company | | | Implied Equity Market Cap ($)(1) | | | Total Enterprise Value ($)(1) | | | Headquarters | | | REIT Sector |
Acadia Realty Trust | | | 2,017 | | | 4,388 | | | Rye, NY | | | Shopping Centers |
Brixmor Property Group Inc. | | | 7,552 | | | 12,353 | | | New York, NY | | | Shopping Centers |
Empire State Realty Trust, Inc. | | | 2,510 | | | 4,122 | | | New York, NY | | | Office |
Kite Realty Group Trust | | | 4,822 | | | 6,048 | | | Indianapolis, IN | | | Shopping Centers |
LXP Industrial Trust | | | 4,447 | | | 5,974 | | | New York, NY | | | Diversified |
Paramount Group, Inc. | | | 2,008 | | | 5,865 | | | New York, NY | | | Office |
Phillips Edison & Company, Inc. | | | 4,183 | | | 6,031 | | | Cincinnati, OH | | | Shopping Centers |
Retail Opportunity Investments Corp. | | | 2,572 | | | 3,828 | | | San Diego, CA | | | Shopping Centers |
Seritage Growth Properties | | | 805 | | | 2,348 | | | New York, NY | | | Free Standing |
SITE Centers Corp. | | | 3,346 | | | 5,294 | | | Beachwood, OH | | | Shopping Centers |
Spirit Realty Capital, Inc. | | | 6,154 | | | 9,089 | | | Dallas, TX | | | Free Standing |
Tanger Factory Outlet Centers, Inc. | | | 2,099 | | | 3,456 | | | Greensboro, NC | | | Shopping Centers |
Veris Residential, Inc. | | | 1,837 | | | 4,306 | | | Jersey City, NJ | | | Diversified |
Urban Edge Properties | | | 2,318 | | | 3,705 | | | New York, NY | | | Shopping Centers |
| Company | Implied Equity Market Cap ($)(1) | Total Enterprise Value ($)(1) | Headquarters | REIT Sector | ||||
| Acadia Realty Trust | 2,419.6 | 4,561.9 | Rye, NY | Shopping Centers | ||||
| Empire State Realty Trust, Inc. | 6,159.0 | 7,312.1 | New York, NY | Office | ||||
| Kite Realty Group Trust | 1,677.4 | 3,359.8 | Indianapolis, IN | Shopping Centers | ||||
| Lexington Realty Trust | 2,357.3 | 4,419.5 | New York, NY | Diversified | ||||
| Mack-Cali Realty Corp. | 2,163.6 | 4,933.0 | Jersey City, NJ | Specialty | ||||
| Paramount Group, Inc. | 4,201.1 | 8,005.4 | New York, NY | Office | ||||
| Pennsylvania Real Estate Investment Trust | 929.8 | 2,955.4 | Philadelphia, PA | Regional Malls | ||||
| Retail Opportunity Investments Corp. | 2,473.7 | 3,829.4 | San Diego, CA | Shopping Centers | ||||
| Retail Properties of America, Inc. | 3,050.6 | 4,881.2 | Oak Brook, IL | Shopping Centers | ||||
| Seritage Growth Properties | 2,315.1 | 3,495.6 | New York, NY | Regional Malls | ||||
| Spirit Realty Capital, Inc. | 39,911.6 | 7,762.8 | Dallas, TX | Free Standing | ||||
| Tanger Factory Outlet Centers, Inc. | 2,639.2 | 4,404.4 | Greensboro, NC | Shopping Centers | ||||
| Washington Prime Group Inc. | 157.5 | 4,720.5 | Columbus, OH | Shopping Centers | ||||
| Weingarten Realty Investors | 4,268.5 | 6,620.6 | Houston, TX | Regional Malls | ||||
| Urban Edge Properties | 3,225.7 | 4,253.7 | New York, NY | Shopping Centers | ||||
| (1) | As of December 31, 2021 (in $ millions). |
| Name | 2017 Annual Base Salary | 2016 Annual Base Salary | | 2021 Annual Base Salary | | 2020 Annual Base Salary | ||||
| Mr. Olson | $1,000,000 | $1,000,000 | | $1,050,000 | | $1,050,000 | ||||
Mr. Weilminster | | 600,000 | | 600,000 | ||||||
| Mr. Langer | $525,000 | $525,000 | | 603,750 | | 603,750 | ||||
| Mr. Minutoli | $500,000 | $500,000 | ||||||||
| Mr. Zucker | $425,000 | $325,000 | ||||||||
| Mr. Eilberg | $350,000 | $350,000 | | 367,500 | | 367,500 | ||||
Mr. Milton | | 400,000 | | 393,750 | ||||||
Executive | | | Threshold | | | Target | | | Maximum |
Mr. Olson | | | 55% | | | 110% | | | 220% |
Mr. Weilminster | | | 50% | | | 100% | | | 175% |
Mr. Langer | | | 50% | | | 100% | | | 175% |
Mr. Eilberg | | | 50% | | | 115% | | | 150% |
Mr. Milton | | | 50% | | | 100% | | | 150% |
Performance Measures – Messrs. Olson, Langer & Milton | | | Weighting | | | Performance Range |
FFO as Adjusted (per share) | | | 40% | | | $0.80 - $1.06 |
Development/Redevelopment: Pipeline to Active (in $ millions)(1) | | | 15% | | | $50 - $100 |
Backfill Anchor Box Vacancies (# of leases signed) | | | 15% | | | 3 - 7 |
Acquisitions & Dispositions (in $ millions) | | | 10% | | | $50 - $150 |
Compensation Committee’s Evaluation | | | 20% | | | 1 - 5 |
| | | 100% | | |
Performance Measures – Mr. Weilminster | | | Weighting | | | Performance Range |
FFO as Adjusted (per share) | | | 35% | | | $0.80 - $1.06 |
Development/Redevelopment: Pipeline to Active (in $ millions)(1) | | | 15% | | | $50 - $100 |
Backfill Anchor Box Vacancies (# of leases signed) | | | 25% | | | 3 - 7 |
Acquisitions & Dispositions (in $ millions) | | | 10% | | | $50 - $150 |
Compensation Committee’s Evaluation | | | 15% | | | 1 - 5 |
| | | 100% | | |
Performance Measures – Mr. Eilberg | | | Weighting | | | Performance Range |
FFO as Adjusted (per share) | | | 30% | | | $0.80 - $1.06 |
Development/Redevelopment: Pipeline to Active (in $ millions)(1) | | | 10% | | | $50 - $100 |
Backfill Anchor Box Vacancies (# of leases signed) | | | 10% | | | 3 - 7 |
Acquisitions & Dispositions (in $ millions) | | | 30% | | | $50 - $150 |
Compensation Committee’s Evaluation | | | 20% | | | 1 - 5 |
| | | 100% | | |
| (1) | Determined by reference to amount of estimated gross cost that is moved from development pipeline to active status. |
| Executive | Threshold | Target | Maximum | |||
| Mr. Olson | 50% | 100% | 200% | |||
| Mr. Langer | 50% | 100% | 175% | |||
| Mr. Minutoli | 50% | 100% | 175% | |||
| Mr. Zucker | 50% | 100% | 150% | |||
| Mr. Eilberg | 50% | 115% | 150% | |||
Name | | | Actual STI Award as % of Base Salary | | | Actual 2021 STI Cash Award($)(1) |
Mr. Olson | | | 193% | | | $2,021,250 |
Mr. Weilminster | | | 145% | | | 870,000 |
Mr. Langer | | | 156% | | | 943,359 |
Mr. Eilberg | | | 147% | | | 538,388 |
Mr. Milton | | | 138% | | | 550,000 |
| (1) | The cash awards were paid in February 2022 and are reflected in the Non-Equity Incentive Plan Compensation column for 2021 in the Summary Compensation Table below. |
| Name | Total STI Award (as % of Base Salary) | Actual 2017 STI Cash Award | Actual 2017 STI Equity Award(1) | |||
| Mr. Olson | 160% | $800,634 | $800,615 | |||
| Mr. Langer | 153% | $401,751 | $401,747 | |||
| Mr. Minutoli | 137% | $684,384 | - | |||
| Mr. Zucker | 127% | $268,825 | $268,812 | |||
| Mr. Eilberg | 138% | $241,951 | $241,935 | |||
Name | | | Threshold Units(1) | | | Target Units | | | Maximum Potential Units(2) | | | Grant Date Value ($)(3) |
Mr. Olson | | | 45,895 | | | 114,739 | | | 189,321 | | | 1,849,978 |
Mr. Weilminster | | | 18,606 | | | 46,515 | | | 76,751 | | | 749,978 |
Mr. Langer | | | 11,348 | | | 28,373 | | | 46,815 | | | 457,468 |
Mr. Eilberg | | | 4,961 | | | 12,403 | | | 20,467 | | | 199,978 |
Mr. Milton | | | 2,652 | | | 6,632 | | | 10,944 | | | 106,931 |
| (1) | Represents the number of units earned if the minimum threshold for the performance-based 2021 LTI Awards is met (40% of the Target Units). |
| (2) | Represents the maximum number of units earned if the maximum performance thresholds are met (165% of the Target Units). |
| (3) | Represents the grant date fair value computed in accordance with FASB ASC 718. |
Performance Level | | | Absolute TSR | | | % of Target Units Earned |
Threshold | | | 18% | | | 40% |
Target | | | 27% | | | 100% |
Maximum | | | 36% or higher | | | 165% |
Performance Level | | | Relative TSR | | | % of Target Units Earned |
Threshold | | | 35th Percentile | | | 40% |
Target | | | 55th Percentile | | | 100% |
Maximum | | | 75th Percentile or higher | | | 165% |
Name | | | Time-Based Vesting LTIP Units | | | Grant Date Value($)(1) |
Mr. Olson | | | 128,830 | | | 1,849,999 |
Mr. Weilminster | | | 53,003 | | | 749,992 |
Mr. Langer | | | 32,330 | | | 457,470 |
Mr. Eilberg | | | 14,134 | | | 199,996 |
Mr. Milton | | | 7,558 | | | 106,946 |
| (1) | Represents the grant date fair value computed in accordance with FASB ASC 718. |
Name | | | Threshold Units | | | Target Units | | | Maximum Potential Units | | | Total Units Earned |
Mr. Olson | | | 35,770 | | | 89,424 | | | 147,550 | | | 28,754 |
Mr. Weilminster | | | 27,387 | | | 68,467 | | | 112,970 | | | 22,704 |
Mr. Langer | | | 12,258 | | | 30,644 | | | 50,563 | | | 10,162 |
Mr. Eilberg | | | 3,502 | | | 8,755 | | | 14,446 | | | 2,903 |
Mr. Milton | | | 3,502 | | | 8,755 | | | 14,446 | | | 2,903 |
| Executive | Threshold Units(1) | Target Units | Maximum Potential Units(2) | Grant Date Value(3) | ||||
| Mr. Olson | 15,272 | 45,816 | 76,361 | $1,027,624 | ||||
| Mr. Langer | 10,690 | 32,071 | 53,452 | $719,330 | ||||
| Mr. Minutoli | 12,217 | 36,652 | 61,088 | $822,092 | ||||
| Mr. Zucker | 6,108 | 18,326 | 30,544 | $411,046 | ||||
| Mr. Eilberg | 3,054 | 9,163 | 15,272 | $205,523 | ||||
Name | | | Threshold Units(1) | | | Target Units | | | Maximum Potential Units(2) | | | Grant Date Value ($)(3) |
Mr. Olson | | | 64,382 | | | 160,954 | | | 265,574 | | | 2,466,667 |
Mr. Weilminster | | | 26,100 | | | 65,251 | | | 107,664 | | | 1,000,000 |
Mr. Langer | | | 15,920 | | | 39,800 | | | 65,670 | | | 609,963 |
Mr. Eilberg | | | 6,960 | | | 17,399 | | | 28,708 | | | 266,667 |
Mr. Milton | | | 3,504 | | | 8,760 | | | 14,454 | | | 134,275 |
| Absolute TSR Component (25% of the Award) | % of Maximum Award Earned | |
| 21.0% | 20.0% | |
| 39.0% | 60.0% | |
| 50.0% | 100.0% | |
| (1) | ||
| (2) | Represents the maximum number of units earned if the maximum performance thresholds are met (165% of the Target Units). |
| (3) | Represents the grant date fair value computed in accordance with FASB ASC 718. |
| Executive | Threshold Units(1) | Target Units(2) | Maximum Potential Units(3) | Grant Date Value(4) | ||||
| Mr. Olson | 25,517 | 63,793 | 105,258 | $1,167,292 | ||||
| Mr. Langer | 11,741 | 29,353 | 48,432 | $537,100 | ||||
| Mr. Minutoli | 16,773 | 41,932 | 69,188 | $767,286 | ||||
| Mr. Zucker | 6,709 | 16,773 | 27,675 | $306,914 | ||||
| Mr. Eilberg | 3,355 | 8,386 | 13,838 | $153,457 | ||||
Absolute TSR Component (25% of the Award) | % of Target Units Earned | |
| 18% | 40% | |
| 27% | 100% | |
| 36% | 165% | |
Performance Level | | | Absolute TSR | | | % of Target Units Earned |
Threshold | | | 18% | | | 40% |
Target | | | 27% | | | 100% |
Maximum | | | 36% or higher | | | 165% |
Performance Level | | | Relative TSR | | | % of Target Units Earned |
Threshold | | | 35th Percentile | | | 40% |
Target | | | 55th Percentile | | | 100% |
Maximum | | | 75th Percentile or higher | | | 165% |
| Name | Time-Based Vesting LTIP Units | Grant Date Value | ||
| Mr. Olson | 13,485 | $291,823 | ||
| Mr. Langer | 6,182 | $134,275 | ||
Mr. Minutoli (1) | — | — | ||
| Mr. Zucker | 3,546 | $76,729 | ||
| Mr. Eilberg | 1,733 | $38,364 | ||
Title | | | Multiple |
Chairman and CEO | | | 5x Base Salary |
CFO | | | 3x Base Salary |
COO | | | 3x Base Salary |
Name and Principal Position | | | Year | | | Salary ($) | | | Bonus ($) | | | Stock Awards ($)(1) | | | Option Awards ($)(2) | | | Non-Equity Incentive Plan Compensation ($)(3) | | | All Other Compensation ($)(4) | | | Total ($) |
Jeffrey S. Olson Chairman and Chief Executive Officer | | | 2021 | | | 1,050,000 | | | — | | | 3,699,999 | | | — | | | 2,021,250 | | | 58,855 | | | 6,830,104 |
| | 2020 | | | 1,042,308 | | | 924,000 | | | 4,005,254 | | | — | | | — | | | 177,499 | | | 6,149,061 | ||
| | 2019 | | | 1,000,000 | | | — | | | 2,378,490 | | | 499,997 | | | 915,825 | | | 227,972 | | | 5,022,284 | ||
Mark J. Langer Executive Vice President and Chief Financial Officer | | | 2021 | | | 603,750 | | | — | | | 914,618 | | | — | | | 943,359 | | | 52,000 | | | 2,513,727 |
| | 2020 | | | 599,327 | | | 483,000 | | | 1,070,623 | | | — | | | — | | | 54,787 | | | 2,207,737 | ||
| | 2019 | | | 534,615 | | | — | | | 863,194 | | | 199,998 | | | 467,119 | | | 124,950 | | | 2,189,876 | ||
Christopher J. Weilminster Executive Vice President and Chief Operating Officer | | | 2021 | | | 600,000 | | | — | | | 1,499,462 | | | — | | | 870,000 | | | 52,940 | | | 3,022,402 |
| | 2020 | | | 557,692 | | | 480,000 | | | 1,768,762 | | | — | | | — | | | 53,894 | | | 2,860,348 | ||
| | 2019 | | | 500,000 | | | — | | | 2,222,740 | | | — | | | 557,600 | | | 62,264 | | | 3,342,604 | ||
Herbert Eilberg Chief Investment Officer | | | 2021 | | | 367,500 | | | — | | | 399,855 | | | — | | | 538,388 | | | 17,125 | | | 1,322,868 |
| | 2020 | | | 364,808 | | | 300,000 | | | 506,029 | | | — | | | — | | | 17,125 | | | 1,187,962 | ||
| | 2019 | | | 350,000 | | | — | | | 331,853 | | | — | | | 318,115 | | | 16,750 | | | 1,016,718 | ||
Robert C. Milton III Executive Vice President, General Counsel & Secretary | | | 2021 | | | 399,039 | | | — | | | 213,826 | | | — | | | 550,000 | | | 22,000 | | | 1,184,865 |
| | 2020 | | | 390,866 | | | 315,000 | | | 301,431 | | | — | | | — | | | 17,225 | | | 1,024,522 |
| Name and Principal Position | Year | Salary ($) | Bonus ($) | Stock Awards ($)(1) | Option Awards ($)(2) | Non-Equity Incentive Plan Compensation ($)(3) | All Other Compensation ($)(4) | Total ($) | |||||||||||||||||||||||
| Jeffrey S. Olson | 2017 | $ | 1,000,000 | $ | — | $ | 1,927,600 | $ | 499,999 | $ | 800,634 | $ | 154,581 | $ | 4,382,814 | ||||||||||||||||
Chairman and Chief Executive Officer | 2016 | $ | 1,000,000 | $ | — | $ | 500,000 | $ | 500,000 | $ | 900,000 | $ | 152,759 | $ | 3,052,759 | ||||||||||||||||
| 2015 | $ | 1,000,000 | $ | 500,000 | $ | 5,294,484 | $ | 8,305,784 | $ | — | $ | 151,798 | $ | 15,252,066 | |||||||||||||||||
| Mark J. Langer | 2017 | $ | 525,000 | $ | — | $ | 1,120,851 | $ | 199,995 | $ | 342,192 | $ | 108,202 | $ | 2,355,799 | ||||||||||||||||
Executive Vice President and Chief Financial Officer | 2016 | $ | 525,000 | $ | — | $ | 262,500 | $ | 200,000 | $ | 401,543 | $ | 105,917 | $ | 1,494,960 | ||||||||||||||||
| 2015 | $ | 343,269 | $ | 262,500 | $ | 1,600,748 | $ | 500,000 | $ | — | $ | 138,257 | $ | 2,844,774 | |||||||||||||||||
| Robert Minutoli | 2017 | $ | 500,000 | $ | 100,000 | $ | 1,172,083 | $ | — | $ | 684,384 | $ | 69,000 | $ | 2,525,467 | ||||||||||||||||
| Executive Vice President and Chief Operating Officer | 2016 | $ | 500,000 | $ | — | $ | 350,000 | $ | — | $ | 781,250 | $ | 66,000 | $ | 1,697,250 | ||||||||||||||||
| 2015 | $ | 500,000 | $ | 500,000 | $ | 3,079,049 | $ | — | $ | — | $ | 51,116 | $ | 4,130,165 | |||||||||||||||||
| Michael Zucker | 2017 | $ | 425,000 | $ | — | 235,375 | $ | 721,418 | $ | — | $ | 268,825 | $ | 34,000 | $ | 1,449,243 | |||||||||||||||
| Executive Vice President - Leasing | 2016 | $ | 325,000 | $ | 75,000 | $ | 200,000 | $ | — | $ | 235,372 | $ | 31,500 | $ | 866,872 | ||||||||||||||||
| 2015 | $ | 325,000 | $ | 200,000 | $ | 427,891 | $ | 49,996 | $ | — | $ | 31,500 | $ | 1,034,387 | |||||||||||||||||
| Herbert Eilberg | 2017 | $ | 350,000 | $ | — | $ | 450,015 | $ | — | $ | 241,954 | $ | 16,000 | $ | 1,057,969 | ||||||||||||||||
| Chief Investment Officer | 2016 | $ | 350,000 | $ | — | $ | 200,000 | $ | — | $ | 244,508 | $ | 13,500 | $ | 808,008 | ||||||||||||||||
| 2015 | $ | 228,846 | $ | 200,000 | $ | 648,944 | $ | — | $ | — | $ | 209 | $ | 1,077,999 | |||||||||||||||||
(1) | The amounts listed do not represent the actual amounts paid in cash to or value realized by the NEOs. The valuation is based on the grant date fair value computed in accordance with FASB ASC Topic 718. |
(2) | The amounts listed do not represent the actual amounts paid in cash to or value realized by the NEOs. The valuation |
| (3) | The amounts listed in the |
| The following table sets forth 2021 other compensation earned by or granted to |
Name | | | Car Allowance/ Use of Car and Driver ($)(a) | | | Commuting Costs ($)(b) | | | Reimbursement for Benefit Expenses Not Covered ($)(c) | | | Matching 401(k) Contribution ($) | | | HSA Contribution ($) | | | Total ($) |
Mr. Olson | | | 39,355 | | | — | | | — | | | 19,500 | | | — | | | 58,855 |
Mr. Langer | | | — | | | — | | | 30,000 | | | 19,500 | | | 2,500 | | | 52,000 |
Mr. Weilminster | | | 18,000 | | | 12,940 | | | — | | | 19,500 | | | 2,500 | | | 52,940 |
Mr. Eilberg | | | — | | | — | | | — | | | 14,625 | | | 2,500 | | | 17,125 |
Mr. Milton | | | — | | | — | | | — | | | 19,500 | | | 2,500 | | | 22,000 |
| Name | Year | Car Allowance/Use of Car and Driver ($)(1) | Reimbursement for Benefit Expenses Not Covered ($)(2) | Matching 401(k) Contribution ($) | HSA Contribution ($) | Total ($) | ||||||||||||||||
| Jeffrey S. Olson | 2017 | $ | 141,081 | $ | — | $ | 13,500 | $ | — | $ | 154,581 | |||||||||||
| Mark J. Langer | 2017 | $ | 62,202 | $ | 30,000 | $ | 13,500 | $ | 2,500 | $ | 108,202 | |||||||||||
| Robert Minutoli | 2017 | $ | 18,000 | $ | 30,000 | $ | 18,000 | $ | 3,000 | $ | 69,000 | |||||||||||
| Michael Zucker | 2017 | $ | 18,000 | $ | — | $ | 13,500 | $ | 2,500 | $ | 34,000 | |||||||||||
| Herbert Eilberg | 2017 | $ | — | $ | — | $ | 13,500 | $ | 2,500 | $ | 16,000 | |||||||||||
| Mr. Olson was provided with a car and a driver, |
| (b) | Represents reimbursement for travel expenses from Mr. Weilminster’s current residence to the Company’s offices in New York, New York and Paramus, New Jersey. |
| The figures here represent the sum of the cost of the NEOs reimbursement for medical premiums, supplemental group term life insurance, and supplemental |
| | | | | Estimated Possible Payouts Under Non-Equity Incentive Plan Awards(1) | | | Estimated Future Payouts Under Equity Incentive Plan Award(2) | | | All other Stock Awards: Number of Shares of stock or units (#)(3) | | | Grant Date Fair Value of Stock Awards ($)(4) | ||||||||||||||
Name | | | Grant Date | | | Threshold ($) | | | Target ($) | | | Maximum ($) | | | Threshold (#) | | | Target (#) | | | Maximum (#) | | |||||
Mr. Olson | | | 2/10/21 | | | | | | | | | | | | | | | 128,830 | | | 1,849,999 | ||||||
| | | 2/10/21 | | | | | | | | | 45,895 | | | 114,739 | | | 189,321 | | | | | 1,849,978 | |||||
| | | | | 577,500 | | | 1,155,000 | | | 2,310,000 | | | | | | | | | | | |||||||
Mr. Langer | | | 2/10/21 | | | | | | | | | | | | | | | 32,330 | | | 457,470 | ||||||
| | | 2/10/21 | | | | | | | | | 11,348 | | | 28,373 | | | 46,815 | | | | | 457,468 | |||||
| | | | | 301,875 | | | 603,750 | | | 1,056,563 | | | | | | | | | | | |||||||
Mr. Weilminster | | | 2/10/21 | | | | | | | | | | | | | | | 53,003 | | | 749,992 | ||||||
| | | 2/10/21 | | | | | | | | | 18,606 | | | 46,515 | | | 76,751 | | | | | 749,978 | |||||
| | | | | 300,000 | | | 600,000 | | | 1,050,000 | | | | | | | | | | | |||||||
Mr. Eilberg | | | 2/10/21 | | | | | | | | | | | | | | | 14,134 | | | 199,996 | ||||||
| | | 2/10/21 | | | | | | | | | 4,961 | | | 12,403 | | | 20,467 | | | | | 199,978 | |||||
| | | | | 183,750 | | | 422,625 | | | 551,250 | | | | | | | | | | | |||||||
Mr. Milton | | | 2/10/21 | | | | | | | | | | | | | | | 7,558 | | | 106,946 | ||||||
| | | 2/10/21 | | | | | | | | | 2,652 | | | 6,632 | | | 10,944 | | | | | 106,931 | |||||
| | | | | 200,000 | | | 400,000 | | | 600,000 | | | | | | | | | | | |||||||
| (1) | The dollar amounts presented in these columns represent awards at threshold, target and maximum levels under the 2021 STI Program. The actual award amounts earned under the 2021 STI Program and additional detail are set forth under “Results under 2021 STI Program” on page 37. |
| (2) | The unit amounts presented in these columns represent the performance-based 2021 LTI Awards at threshold, target and maximum levels. See “Long-Term Equity-Based Compensation – 2021 Awards” on page 38 for further information regarding these awards. |
| (3) | On February 10, 2021, as part of the 2021 LTI Awards, the Company granted Mr. Olson 128,830 time-based LTIP Units with 1∕4 vesting annually on February 10th each year beginning with 2022, and Messrs. Eilberg, Langer, Milton and Weilminster 14,134; 32,330; 7,558 and 53,003 LTIP Units, respectively, with 1∕3 vesting annually on February 10th each year beginning with 2022. All of these restricted LTIP Units, which are only subject to time-based vesting based on continued employment through a specified date, entitle the holders to receive cash distributions whether or not then vested. |
| (4) | The amounts presented in this column represent the full grant date fair value of equity awards (calculated pursuant to FASB ASC Topic 718). |
Estimated Possible Payouts Under Non-Equity Incentive Plan Awards (1) | Estimated Future Payouts Under Equity Incentive Plan Award(2) | |||||||||||||||||||||||||||||||
| Name | Grant Date | Threshold ($) | Target ($) | Maximum ($) | Threshold (#) | Target (#) | Maximum (#) | All other Stock Awards: Number of Securities of stock or units (#) | All other Option Awards: Number of Securities Underlying Options (#) | Exercise or Base Price of Option Awards ($/Sh) | Grant Date Fair Value of Stock and Option Awards ($)(3) | |||||||||||||||||||||
| Jeffrey S. Olson | 2/24/17 | 97,656 | $28.36 | $499,999 | ||||||||||||||||||||||||||||
| 2/24/17 | 31,734 | $899,976 | ||||||||||||||||||||||||||||||
| 2/24/17 | 15,272 | 45,817 | 76,361 | $1,027,624 | ||||||||||||||||||||||||||||
| $ | 500,000 | $ | 1,000,000 | $ | 2,000,000 | |||||||||||||||||||||||||||
Mark J. Langer | 2/24/17 | 39,603 | $28.36 | $199,995 | ||||||||||||||||||||||||||||
| 2/24/17 | 14,158 | $401,521 | ||||||||||||||||||||||||||||||
| 2/24/17 | 10,690 | 32,071 | 53,452 | $719,330 | ||||||||||||||||||||||||||||
| $ | 262,500 | $ | 525,000 | $ | 918,750 | |||||||||||||||||||||||||||
| Robert Minutoli | 2/24/17 | 12,341 | $349,991 | |||||||||||||||||||||||||||||
| 2/24/17 | 12,217 | 36,653 | 61,088 | $822,092 | ||||||||||||||||||||||||||||
| $ | 250,000 | $ | 500,000 | $ | 875,000 | |||||||||||||||||||||||||||
Michael Zucker | 2/24/17 | 10,944 | $310,372 | |||||||||||||||||||||||||||||
| 2/24/17 | 6,108 | 18,326 | 30,544 | $411,046 | ||||||||||||||||||||||||||||
| $ | 212,500 | $ | 425,000 | $ | 637,500 | |||||||||||||||||||||||||||
Herbert Eilberg | 2/24/17 | 8,621 | $244,492 | |||||||||||||||||||||||||||||
| 2/24/17 | 3,054 | 9,163 | 15,272 | $205,523 | ||||||||||||||||||||||||||||
| $ | 175,000 | $ | 402,500 | $ | 525,000 | |||||||||||||||||||||||||||
| Stock Awards | |||||
| Name | Number of Shares Acquired on Vesting (#) | Value Realized on Vesting ($)(1) | |||
| Jeffrey S. Olson | 5,315 | $150,733 | |||
| Mark J. Langer | 14,234 | $403,676 | |||
| Robert Minutoli | 11,165 | $316,639 | |||
| Michael Zucker | 3,516 | $99,714 | |||
| Herbert Eilberg | 5,278 | $149,684 | |||
| | | Stock Awards | ||||
Name | | | Number of Shares Acquired on Vesting (#) | | | Value Realized on Vesting ($)(1) |
Mr. Olson | | | 57,500 | | | 961,406 |
Mr. Weilminster | | | 82,266 | | | 1,437,430 |
Mr. Langer | | | 24,904 | | | 414,674 |
Mr. Eilberg | | | 12,729 | | | 212,082 |
Mr. Milton | | | 10,921 | | | 181,856 |
| (1) | Computed by multiplying the number of |
| | | Option Awards | | | Stock Awards | |||||||||||||||||||
Name | | | Number of Securities Underlying Unexercised Options (#) Exercisable | | | Number of Securities Underlying Unexercised Options (#) Unexercisable | | | Option Exercise Price ($) | | | Option Expiration Date | | | Number of Shares or Units of Stock That Have Not Vested (#) | | | Market Value of Shares or Units of Stock That Have Not Vested($)(1) | | | Equity Incentive Plan Awards: Number of Unearned Shares, Units, or Other Rights That Have Not Vested (#)(2) | | | Equity Incentive Plan Awards: Market or Payout Value of Unearned Shares, Units or Other Rights That Have Not Vested ($)(1) |
Mr. Olson | | | 64,266 | | | 64,268(3) | | | 19.53 | | | 2/27/29 | | | | | | | | | ||||
| | | 78,451 | | | 26,151(4) | | | 21.64 | | | 2/22/28 | | | | | | | | | |||||
| | | 97,656 | | | | | 28.36 | | | 2/24/27 | | | | | | | | | ||||||
| | | 140,056 | | | | | 23.52 | | | 2/8/26 | | | | | | | | | ||||||
| | | 2,092,137 | | | | | 23.90 | | | 2/17/25 | | | �� | | | | | | ||||||
| | | | | | | | | | | 237,427(5) | | | 4,511,113 | | | 164,436(6) | | | 3,124,288 | |||||
Mr. Weilminster | | | 333,333 | | | 666,667(7) | | | 21.72 | | | 9/27/28 | | | | | | | | | ||||
| | | | | | | | | | | 182,942(5) | | | 3,475,898 | | | 79,548(6) | | | 1,511,416 | |||||
Mr. Langer | | | 34,452 | | | 17,227(3) | | | 19.53 | | | 2/27/29 | | | | | | | | | ||||
| | | 42,283 | | | | | 21.64 | | | 2/22/28 | | | | | | | | | ||||||
| | | 39,603 | | | | | 28.36 | | | 2/24/27 | | | | | | | | | ||||||
| | | 56,657 | | | | | 23.52 | | | 2/8/26 | | | | | | | | | ||||||
| | | 127,551 | | | | | 23.52 | | | 4/20/25 | | | | | | | | | ||||||
| | | | | | | | | | | 57,868(5) | | | 1,099,492 | | | 44,074(6) | | | 837,398 | |||||
Mr. Eilberg | | | | | | | | | | | 27,167(5) | | | 516,173 | | | 17,411(6) | | | 330,801 | ||||
Mr. Milton | | | | | | | | | | | 17,755(5) | | | 337,345 | | | 10,721(6) | | | 203,699 | ||||
| (1) | Value based on number of shares or units multiplied by $19.00, which was the price of Common Shares as of the close of business on December 31, 2021. |
| (2) | The awards under the column entitled “Equity Incentive Plan Awards: Number of Unearned Shares, Units or Other Rights That Have Not Vested” are awards of LTIP Units that remained subject to performance-based vesting conditions and were granted as 2021 LTI Awards, 2020 LTI Awards and 2019 LTI Awards. These LTIP Units do not have any value unless specified performance criteria are met and specified criteria for converting and/or redeeming the LTIP Units for Common Shares are also met. As of December 31, 2021, these criteria had not been met (as the relevant measurement periods had not yet ended). In accordance with SEC rules, these rewards are reflected in the table in the manner set forth in Footnote (9) below. |
| (3) | Represents unvested Options, granted on February 27, 2019, scheduled to vest, for Mr. Olson, in equal installments on February 27, 2022 and February 27, 2023 and, for Mr. Langer, on February 27, 2022, in each case subject to continued employment through such dates. |
| (4) | Represents unvested Options, granted on February 22, 2018, scheduled to vest on February 23, 2022 subject to continued employment through such date. |
| (5) | The number of shares or units of stock that have not vested include the following: |
| | | 2017 Bonus/ 2018 Make Whole Awards | | | 2018 Inducement Award(b) | | | 2018 Time Based LTI Award(c) | | | 2018 Bonus Award(d) | | | 2019 Time Based LTI Award(e) | | | 2019 Bonus Award(f | | | 2020 Time- Based LTI Award(g) | | | 2021 Time- Based LTI Award(h) | | | Total | |
Mr. Olson | | | 9,250(a) | | | – | | | 3,372 | | | 12,708 | | | 17,024 | | | 13,143 | | | 53,100 | | | 128,830 | | | 237,427 |
Mr. Weilminster | | | | | 88,184 | | | 13,764 | | | – | | | 8,690 | | | – | | | 19,301 | | | 53,003 | | | 182,942 | |
Mr. Langer | | | – | | | – | | | – | | | 3,866 | | | 3,889 | | | 6,010 | | | 11,773 | | | 32,330 | | | 57,868 |
Mr. Eilberg | | | – | | | – | | | – | | | 2,681 | | | 1,111 | | | 4,094 | | | 5,147 | | | 14,134 | | | 27,167 |
Mr. Milton | | | – | | | – | | | – | | | 2,632 | | | 1,111 | | | 3,862 | | | 2,592 | | | 7,558 | | | 17,775 |
| (a) | Represents unvested LTIP Units and Common Shares granted in 2018 as annual bonus for 2017. For Mr. Olson, represents unvested LTIP Units scheduled to vest on February 22, 2022, subject to continued employment through such date. |
| (b) | Represents unvested LTIP Units granted to Mr. Weilminster in 2018 as inducement awards in connection with his hiring by the Company scheduled to vest in equal installments on September 27, 2022 and September 27, 2023, subject to his continued employment through such dates. |
| (c) | Represent unvested LTIP Units granted as time-based 2018 LTI Awards or in lieu of such awards for Mr. Weilminster. For Mr. Olson, represents unvested LTIP Units scheduled to vest on February 22, 2022, subject to continued employment through such date. For Mr. Weilminster represents unvested LTIP Units scheduled to vest on February 27, 2022, subject to continued employment through such date. On February 27, 2019, the Company granted LTIP units that vest ratably over four years on February 27, 2020, February 27, 2021, February 27, 2022 and February 27, 2023. |
| (d) | Represents unvested LTIP Units granted in 2019 as annual bonus for 2018 scheduled to vest, for Mr. Olson, in equal installments on February 27, 2022 and February 27, 2023 and, for Messrs. Langer and Eilberg, on February 27, 2022, in each case, subject to continued employment through such date. |
| (e) | Represent unvested LTIP Units granted as time-based 2019 LTI Awards scheduled to vest, for Mr. Olson, in equal installments on February 27, 2022 and February 27, 2023 and, for the other NEOs, on February 27, 2022, in each case subject to continued employment through such date. |
| (f) | Represents unvested LTIP Units granted in 2020 as annual bonus for 2019 scheduled to vest, for Mr. Olson, in equal installments on February 20, 2022, February 20, 2023 and February 20, 2024 and, for Messrs. Langer, Eilberg and Milton, in equal installments on February 20, 2022 and February 20, 2023, in each case, subject to continued employment through such dates. |
| (g) | Represent unvested LTIP Units granted as time-based 2020 LTI Awards scheduled to vest, for Mr. Olson, in equal installments on February 20, 2022, February 20, 2023 and February 20, 2024 and, for the other NEOs, in equal installments on February 20, 2022 and February 20, 2023, in each case subject to continued employment through such dates. |
| (h) | Represent unvested LTIP Units granted as time-based 2021 LTI Awards scheduled to vest, for Mr. Olson, in equal installments on February 10, 2022, February 10, 2023, February 10, 2024 and February 10, 2025 and, for the other NEOs, in equal installments on February 10, 2022, February 10, 2023 and February 10, 2024, in each case subject to continued employment through such dates. |
| (6) | Reflects performance-based LTIP Unit awards that were outstanding and for which the performance period had not ended as of December 31, 2021. If our performance for the three-year measurement period applicable to these LTIP Units continued to be the same as we experienced from the beginning of the applicable three-year measurement period through December 31, 2021, (i) for 2019 LTI Awards, no amounts would have been earned under the absolute TSR component or relative TSR component, (ii) for 2020 LTI Awards, no amounts would have been earned under the absolute TSR component or the relative TSR component and (iii) for the 2021 LTI Awards, an amount between threshold and target would have been earned under the absolute TSR component and no amounts would have been earned under the relative TSR component. Accordingly, pursuant to SEC rules, the number of units set forth in the table below includes the number of units that would be earned if (i) for 2019 LTI Awards, threshold performance was achieved under the absolute TSR component and relative TSR component, (ii) for 2020 LTI Awards, threshold performance was achieved under the absolute TSR component and relative TSR component and (iii) for the 2021 LTI Awards, target performance was achieved under the absolute TSR component and thresholder performance was achieved under the relative TSR component. |
| | | 2019 LTI Awards (Performance- Based)(a) | | | 2020 LTI Awards (Performance- Based)(b) | | | 2021 LTI Awards (Performance- Based)(c) | | | Total | |
Mr. Olson | | | 35,770 | | | 64,382 | | | 64,285 | | | 164,437 |
Mr. Weilminster | | | 27,387 | | | 26,100 | | | 26,061 | | | 79,548 |
Mr. Langer | | | 12,258 | | | 15,920 | | | 15,896 | | | 44,074 |
Mr. Eilberg | | | 3,502 | | | 6,960 | | | 6,949 | | | 17,411 |
Mr. Milton | | | 3,502 | | | 3,504 | | | 3,715 | | | 10,721 |
| (a) | Represents unearned LTIP Units awarded as performance-based 2019 LTI Awards. These LTIP Units are subject to performance-based vesting based on the achievement of absolute and relative TSR performance criteria over a three-year measurement period ending February 26, 2022. Earned LTIP Units would be subject to vesting based on continued employment, with 50% scheduled to vest on the date performance-based vesting was determined and 25% scheduled to vest on each of February 27, 2023 and February 27, 2024, subject to continued employment through such dates. See “2019 Long-Term Incentive Awards” for more information. |
| (b) | Represents unearned LTIP Units awarded as performance-based 2020 LTI Awards. These LTIP Units are subject to performance-based vesting based on the achievement of absolute and relative TSR performance criteria over a three-year measurement period ending February 20, 2023. Earned LTIP Units would be subject to vesting based on continued employment, with 50% scheduled to vest on the date performance-based vesting was determined and 25% scheduled to vest on each of February 20, 2024 and February 20, 2025, subject to continued employment through such dates. See “2020 Long-Term Incentive Awards” for more information. |
| (c) | Represents unearned LTIP Units awarded as performance-based 2021 LTI Awards. These LTIP Units are subject to performance-based vesting based on the achievement of absolute and relative TSR performance criteria over a three-year measurement period ending February 9, 2024. Earned LTIP Units would be subject to vesting based on continued employment, with 50% scheduled to vest on the date performance-based vesting was determined and 25% scheduled to vest on each of February 10, 2025 and February 10, 2026, subject to continued employment through such dates. See “2021 Long-Term Incentive Awards” for more information. |
| (7) | Represents unvested Options, granted on September 27, 2018, scheduled to vest in equal installments on September 27, 2022 and September 27, 2023, subject to continued employment through such dates. |
Name | | | Salary and Cash Bonus (Multiple) | | | Salary and Cash Bonus ($) | | | Health Benefits ($) | | | Vesting of Equity Awards ($)(1) | | | Total ($) |
Termination by Urban Edge Properties Without Cause or by the Executive for Good Reason | |||||||||||||||
Mr. Olson | | | 2x | | | 6,431,250 | | | 142,752 | | | 4,511,113 | | | 11,085,115 |
Mr. Weilminster | | | 1.5x | | | 2,670,000 | | | 37,815 | | | 3,737,395 | | | 6,445,210 |
Mr. Langer | | | 1.5x | | | 2,754,609 | | | 37,815 | | | 820,743 | | | 3,613,167 |
Mr. Eilberg | | | n/a | | | — | | | — | | | — | | | — |
Mr. Milton | | | n/a | | | — | | | — | | | — | | | — |
Death(2) | |||||||||||||||
Mr. Olson | | | n/a | | | — | | | — | | | 4,511,113 | | | 4,511,113 |
Mr. Weilminster | | | n/a | | | — | | | — | | | 3,737,395 | | | 3,737,395 |
Mr. Langer | | | n/a | | | — | | | — | | | 820,743 | | | 820,743 |
Mr. Eilberg | | | n/a | | | — | | | — | | | 516,173 | | | 516,173 |
Mr. Milton | | | n/a | | | — | | | — | | | 312,702 | | | 312,702 |
Change in Control without Termination(3) | |||||||||||||||
Mr. Olson | | | n/a | | | — | | | — | | | 73,230 | | | 73,230 |
Mr. Weilminster | | | n/a | | | — | | | — | | | 29,687 | | | 29,687 |
Mr. Langer | | | n/a | | | — | | | — | | | 18,109 | | | 18,109 |
Mr. Eilberg | | | n/a | | | — | | | — | | | 7,916 | | | 7,916 |
Mr. Milton | | | n/a | | | — | | | — | | | 4,231 | | | 4,231 |
Termination Following Change in Control(3) | |||||||||||||||
Mr. Olson | | | 3x | | | 8,636,250 | | | 142,752 | | | 4,657,573 | | | 13,436,575 |
Mr. Weilminster | | | 2.5x | | | 3,870,000 | | | 75,630 | | | 3,796,769 | | | 7,742,399 |
Mr. Langer | | | 2.5x | | | 3,962,109 | | | 75,630 | | | 856,960 | | | 4,894,699 |
Mr. Eilberg | | | 1x | | | 790,125 | | | — | | | 532,005 | | | 1,322,130 |
Mr. Milton | | | 2x | | | 1,600,000 | | | — | | | 321,165 | | | 1,921,165 |
| Name | Salary and Cash Bonus (Multiple) | Salary and Cash Bonus | Health Benefits | Vesting of Equity Awards (1) | Total | |||||||||||||
| Termination by Urban Edge Properties Without Cause or by the Executive for Good Reason | ||||||||||||||||||
| Jeffrey S. Olson | 2x | $ | 5,601,268 | $ | 90,129 | $ | 5,834,251 | $ | 11,525,648 | |||||||||
| Mark J. Langer | 1.5x | $ | 2,378,502 | $ | 27,883 | $ | 2,046,394 | $ | 4,452,779 | |||||||||
| Robert Minutoli | n/a | $ | — | $ | — | $ | 868,325 | $ | 868,325 | |||||||||
| Michael Zucker | n/a | $ | — | $ | — | $ | 434,163 | $ | 434,163 | |||||||||
| Herbert Eilberg | n/a | $ | — | $ | — | $ | 217,081 | $ | 217,081 | |||||||||
Death or Disability (2) | ||||||||||||||||||
| Jeffrey S. Olson | n/a | $ | — | $ | — | $ | 5,991,066 | $ | 5,991,066 | |||||||||
| Mark J. Langer | n/a | $ | — | $ | — | $ | 2,156,163 | $ | 2,156,163 | |||||||||
| Robert Minutoli | n/a | $ | — | $ | — | $ | 1,878,100 | $ | 1,878,100 | |||||||||
| Michael Zucker | n/a | $ | — | $ | — | $ | 942,440 | $ | 942,440 | |||||||||
| Herbert Eilberg | n/a | $ | — | $ | — | $ | 777,481 | $ | 777,481 | |||||||||
Change in Control without Termination (3) | ||||||||||||||||||
| Jeffrey S. Olson | n/a | $ | — | $ | — | $ | 834,463 | $ | 834,463 | |||||||||
| Mark J. Langer | n/a | $ | — | $ | — | $ | 584,124 | $ | 584,124 | |||||||||
| Robert Minutoli | n/a | $ | — | $ | — | $ | 667,570 | $ | 667,570 | |||||||||
| Michael Zucker | n/a | $ | — | $ | — | $ | 333,785 | $ | 333,785 | |||||||||
| Herbert Eilberg | n/a | $ | — | $ | — | $ | 166,892 | $ | 166,892 | |||||||||
Termination Following Change in Control (3) | ||||||||||||||||||
| Jeffrey S. Olson | 3x | $ | 7,601,268 | $ | 90,129 | $ | 6,417,771 | $ | 14,109,168 | |||||||||
| Mark J. Langer | 2.5x | $ | 3,428,502 | $ | 55,766 | $ | 2,454,857 | $ | 5,939,125 | |||||||||
| Robert Minutoli | 2.5x | $ | 3,184,384 | $ | — | $ | 2,219,464 | $ | 5,403,848 | |||||||||
| Michael Zucker | n/a | $ | — | $ | — | $ | 1,113,122 | $ | 1,113,122 | |||||||||
| Herbert Eilberg | 1x | $ | 752,500 | $ | — | $ | 698,063 | $ | 1,450,563 | |||||||||
| (1) | LTIP Units and Common Shares that would have vested are valued based on the closing price of the Common Shares on the last business day of 2021, December 31, 2021, which was of $19.00. The value of the options to purchase Common Shares is calculated as the difference between the closing price of the Common Shares on December 31, 2021 and the exercise price of the options. No amounts were included for the performance-based 2019 LTI Awards, the performance-based 2020 LTI Awards or the performance-based 2021 LTI Awards under “Termination by Urban Edge Properties Without Cause or by the Executive for Good Reason” or “Qualifying Death or Disability” as the earning of any such awards would remain subject to the achievement of the performance-based vesting hurdles through the end of the applicable three-year measurement period. Amounts under “Change in Control” for the performance-based 2019 LTI Awards, the performance-based 2020 LTI Awards or the performance-based 2021 LTI Awards reflect the amount that would vest upon the change in control (i.e., 50% of the amount earned based on achievement of the performance-based vesting conditions) and does not include the portion of the award that would remain subject to vesting based on continued employment. |
| (2) | In the event of a disability of December 31, 2021, Mr. Weilminster would receive accelerated vesting of his restricted LTIP Units that were granted to him on September 27, 2018 that are subject to vesting based solely on continued employment, and none of the other NEOs would receive accelerated vesting. |
| (3) | In the event that any payments and benefits to be paid or provided to Messrs. Olson, Weilminster or Langer would be subject to “parachute payment” excise taxes under the Internal Revenue Code of 1986, as amended, such NEO’s payments and benefits will be reduced to the extent necessary to avoid such excise taxes, but only if such a reduction of pay or benefits would result in a greater after-tax benefit to such NEO. |
| | | Amy B. Lane (Chair) | |
| | | Susan L. Givens | |
| | | Michael A. Gould | |
| | | Norman K. Jenkins | |
| | | Kevin O’Shea |
APPROVAL OF THE COMPENSATION OF OUR NAMED EXECUTIVE OFFICERS AS DISCLOSED IN THIS PROXY STATEMENT. |
THE BOARD OF TRUSTEES UNANIMOUSLY RECOMMENDS A VOTE FOR “ONE YEAR” WITH RESPECT TO THE FREQUENCY WITH WHICH A SHAREHOLDER VOTE TO APPROVE, ON A NON-BINDING ADVISORY BASIS, THE COMPENSATION OF OUR NAMED EXECUTIVE OFFICERS AS DISCLOSED IN OUR PROXY STATEMENT. |
| | | Year Ended December 31, | ||||
(Amounts in thousands) | | | 2021 | | | 2020 |
Net income | | | $107,815 | | | $97,750 |
Less net income attributable to noncontrolling interests in: | | | | | ||
Operating partnership | | | (4,296) | | | (4,160) |
Consolidated subsidiaries | | | (833) | | | (1) |
Net income attributable to common shareholders | | | 102,686 | | | 93,589 |
Adjustments: | | | | | ||
Rental property depreciation and amortization | | | 91,468 | | | 95,297 |
Gain on sale of real estate | | | (18,648) | | | (39,775) |
Real estate impairment loss | | | 468 | | | 3,055 |
Limited partnership interests in operating partnership | | | 4,296 | | | 4,160 |
FFO Applicable to diluted common shareholders | | | 180,270 | | | 156,326 |
FFO per diluted common share(1) | | | 1.48 | | | 1.27 |
Adjustments to FFO: | | | | | ||
Impact of lease terminations(2) | | | (44,540) | | | — |
(Reinstatement)/write-off of receivables arising from the straight-lining of rents, net | | | (1,216) | | | 12,025 |
Tax impact of Puerto Rico transactions(3) | | | (1,137) | | | (37,543) |
Transaction, severance and other expenses(4) | | | 861 | | | 6,097 |
Tenant bankruptcy settlement income | | | (771) | | | — |
Write-off of below-market intangibles due to tenant bankruptcies | | | — | | | (1,649) |
Gain on extinguishment of debt | | | — | | | (34,908) |
Executive transition costs | | | — | | | 7,152 |
FFO as Adjusted applicable to diluted common shareholders | | | $133,467 | | | $107,500 |
FFO as Adjusted per diluted common share(1) | | | $1.09 | | | $0.88 |
| | ||||||
Weighted Average diluted common shares(1) | | | 122,107 | | | 122,810 |
Year Ended December 31, 2017 | |||||||
| (in thousands) | (per share) (2) | ||||||
| Net (loss) income | $ | 72,938 | $ | 0.62 | |||
| Less (net income) attributable to noncontrolling interests in: | |||||||
| Operating partnership | (5,824 | ) | (0.05 | ) | |||
| Consolidated subsidiaries | (44 | ) | — | ||||
| Net (loss) income attributable to common shareholders | 67,070 | 0.57 | |||||
| Adjustments: | |||||||
| Rental property depreciation and amortization | 81,401 | 0.68 | |||||
| Real estate impairment loss | 3,467 | 0.03 | |||||
| Limited partnership interests in operating partnership | 5,824 | 0.05 | |||||
FFO applicable to diluted common shareholders(1) | 157,762 | 1.33 | |||||
| Loss on extinguishment of debt | 35,336 | 0.30 | |||||
| Casualty loss | 6,092 | 0.05 | |||||
| Construction settlement due to tenant | 902 | 0.01 | |||||
| Transaction costs | 278 | — | |||||
| Gain on sale of land | (202 | ) | — | ||||
| Tenant bankruptcy settlement income | (655 | ) | (0.01 | ) | |||
| Income tax benefit from hurricane losses | (1,767 | ) | (0.01 | ) | |||
| Income from acquired leasehold interest | (39,215 | ) | (0.33 | ) | |||
FFO as Adjusted applicable to diluted common shareholders(1) | $ | 158,531 | $ | 1.34 | |||
Weighted average diluted common shares - FFO(1) | 118,390 | ||||||
| (1) | Weighted average diluted shares used to calculate FFO per share and FFO as Adjusted per share for the year ended December 31, 2021 and December 31, 2020 are higher than the GAAP weighted average diluted shares as a result of the dilutive impact of LTIP and OP units which may be redeemed for our common shares. |
| (2) | During the year ended December 31, 2021, net income includes $45.9 million of accelerated amortization of below-market lease intangibles resulting from the termination of our leases with Kmart and Sears. The $44.5 million adjustment to FFO in calculating FFO as Adjusted is net of the $1.4 million attributable to the noncontrolling interest in Sunrise Mall. |
| (3) | Amount for the year ended December 31, 2021 reflects final adjustments to local and state income taxes in connection with the debt transactions and legal entity reorganization at our malls in Puerto Rico in 2020. Amount for the year ended December 31, 2020 reflects the original estimated income tax benefit resulting from the debt and legal entity reorganization transactions. |
| (4) | Amount for the year ended December 31, 2020 includes $5.7 million of transaction costs associated with the debt and legal entity reorganization transactions that occurred for the malls in Puerto Rico during the year. |
Twelve Months Ended December 31, | ||||||||
| (Amounts in thousands) | 2017 | 2016 | ||||||
| Net (loss) income | $ | 72,938 | $ | 96,630 | ||||
| Add: income tax (benefit) expense | (278 | ) | 804 | |||||
| Interest income | (2,248 | ) | (679 | ) | ||||
| Gain on sale of real estate | (202 | ) | (15,618 | ) | ||||
| Interest and debt expense | 56,218 | 51,881 | ||||||
| Loss on extinguishment of debt | 35,336 | — | ||||||
| Management and development fee income from non-owned properties | (1,535 | ) | (1,759 | ) | ||||
| Other income | (235 | ) | (121 | ) | ||||
| Depreciation and amortization | 82,281 | 56,145 | ||||||
| Casualty and impairment loss | 7,382 | — | ||||||
| General and administrative expense | 30,413 | 27,438 | ||||||
| Transaction costs | 278 | 1,405 | ||||||
| Less: non-cash revenue and expenses | (47,161 | ) | (6,465 | ) | ||||
| Cash NOI | 233,187 | 209,661 | ||||||
| Adjustments | ||||||||
| Non-same property cash NOI | (46,766 | ) | (28,164 | ) | ||||
| Hurricane relates operating loss | 1,267 | — | ||||||
| Construction settlement due to tenant | 902 | — | ||||||
| Tenant bankruptcy settlement income | (975 | ) | (2,378 | ) | ||||
| Same-property cash NOI | 187,615 | 179,119 | ||||||
| Adjustments: | ||||||||
| Cash NOI related to properties being redeveloped | 25,304 | 22,846 | ||||||
| Same-property cash NOI including properties in redevelopment | $ | 212,919 | $ | 201,965 | ||||
| | | Year Ended December 31, | ||||
(Amounts in thousands) | | | 2021 | | | 2020 |
Net income | | | $107,815 | | | $97,750 |
Management and development fee income from non-owned properties | | | (1,169) | | | (1,283) |
Other expense | | | 608 | | | 672 |
Depreciation and amortization | | | 92,331 | | | 96,029 |
General and administrative expense | | | 39,152 | | | 48,682 |
Real estate impairment loss | | | 468 | | | 3,055 |
Gain on sale of real estate | | | (18,648) | | | (39,775) |
Interest income | | | (360) | | | (2,599) |
Interest and debt expense | | | 57,938 | | | 71,015 |
Gain on extinguishment of debt | | | — | | | (34,908) |
Income tax (benefit) expense | | | 1,139 | | | (38,996) |
Non-cash revenue and expenses | | | (55,463) | | | 741 |
NOI | | | 223,811 | | | 200,383 |
Adjustments: | | | | | ||
Non-same property NOI and other(1) | | | (26,493) | | | (27,836) |
Tenant bankruptcy settlement income and lease termination income | | | (1,313) | | | (1,094) |
Same-property NOI | | | $196,005 | | | $171,453 |
NOI related to properties being redeveloped | | | 20,915 | | | 18,621 |
Same-property NOI including properties in redevelopment | | | $216,920 | | | $190,074 |
| (1) | Non-same property NOI includes NOI related to properties being redeveloped and properties acquired or disposed in the period. Amounts for 2021 include Sunrise Mall which generated a net operating loss of $3.0 million for the year ended December 31, 2021. This amount reflects the total operating loss on the property and includes the portion pertaining to the noncontrolling interest in Sunrise Mall. |
Twelve Months Ended December 31, | ||||||||
| (Amounts in thousands) | 2017 | 2016 | ||||||
| Net (loss) income | $ | 72,938 | $ | 96,630 | ||||
| Depreciation and amortization | 82,281 | 46,145 | ||||||
| Interest and debt expense | 56,218 | 51,881 | ||||||
| Income tax (benefit) expense | (278 | ) | 804 | |||||
| EBITDA | 21,159 | 205,460 | ||||||
| Adjustments for Adjusted EBITDA: | ||||||||
| Casualty loss | 6,092 | — | ||||||
| Construction settlement due to tenant | 902 | — | ||||||
| Real estate impairment loss | 3,467 | — | ||||||
| Transaction costs | 278 | 1,405 | ||||||
| Loss on extinguishment of debt | 35,336 | — | ||||||
| Tenant bankruptcy settlement income | (655 | ) | (2,378 | ) | ||||
| Gain on sale of real estate | (202 | ) | (15,618 | ) | ||||
| Income from acquired leasehold interest | (39,215 | ) | — | |||||
| Adjusted EBITDA | $ | 217,162 | 188,869 | |||||
| | | By Order of
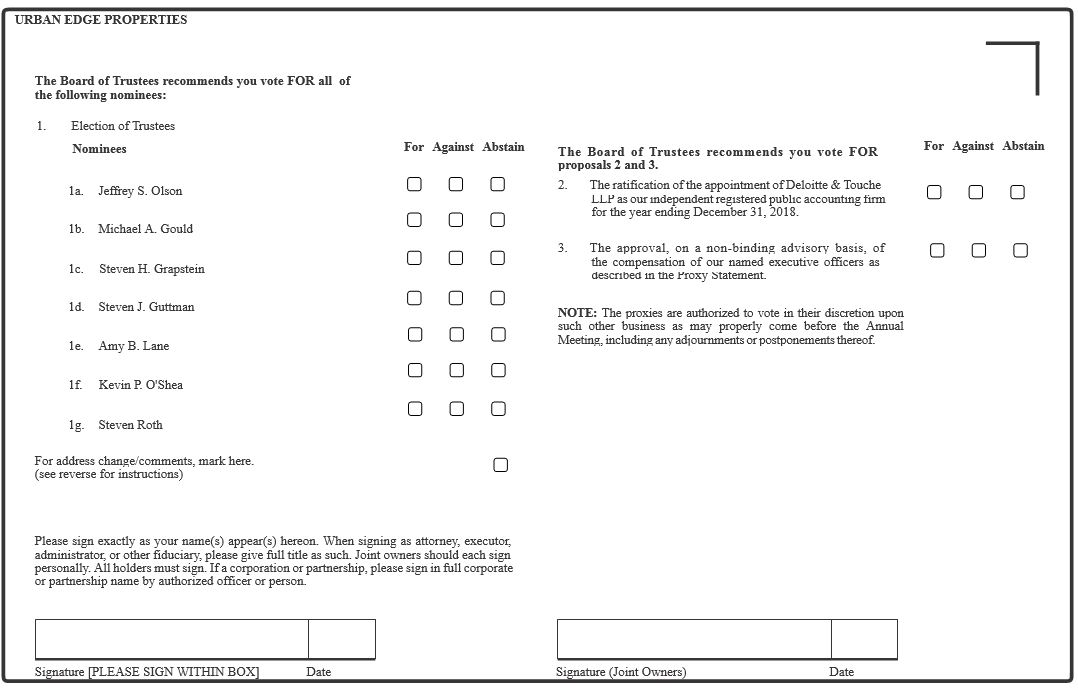
68 | ||||||||||||||||||||||||||||||||||||||||||||||||||||||||||||||||||||||||||||||||||||||||||||||||||||